Introduction
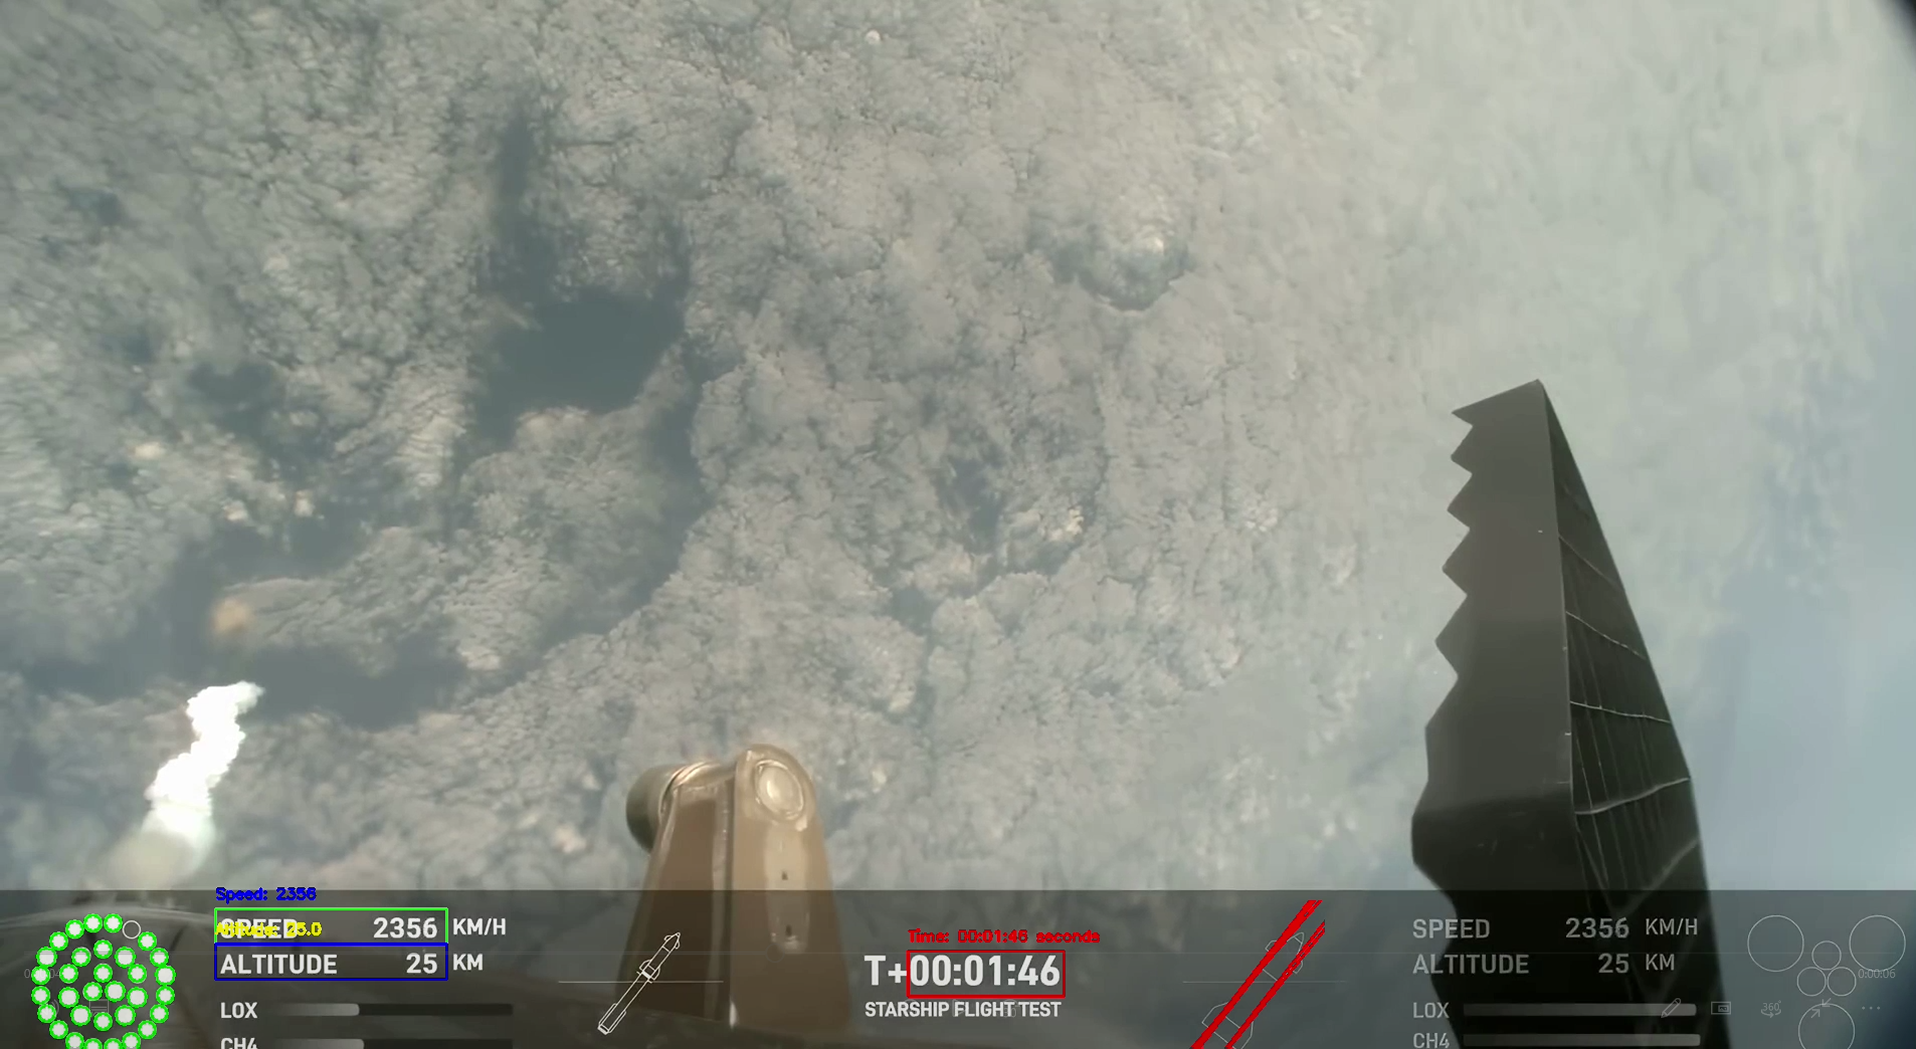
Surely, you’ve watched a rocket launch at some point, either live or in a video, but have you ever wondered what all those numbers on the screen mean, like the speed or altitude?
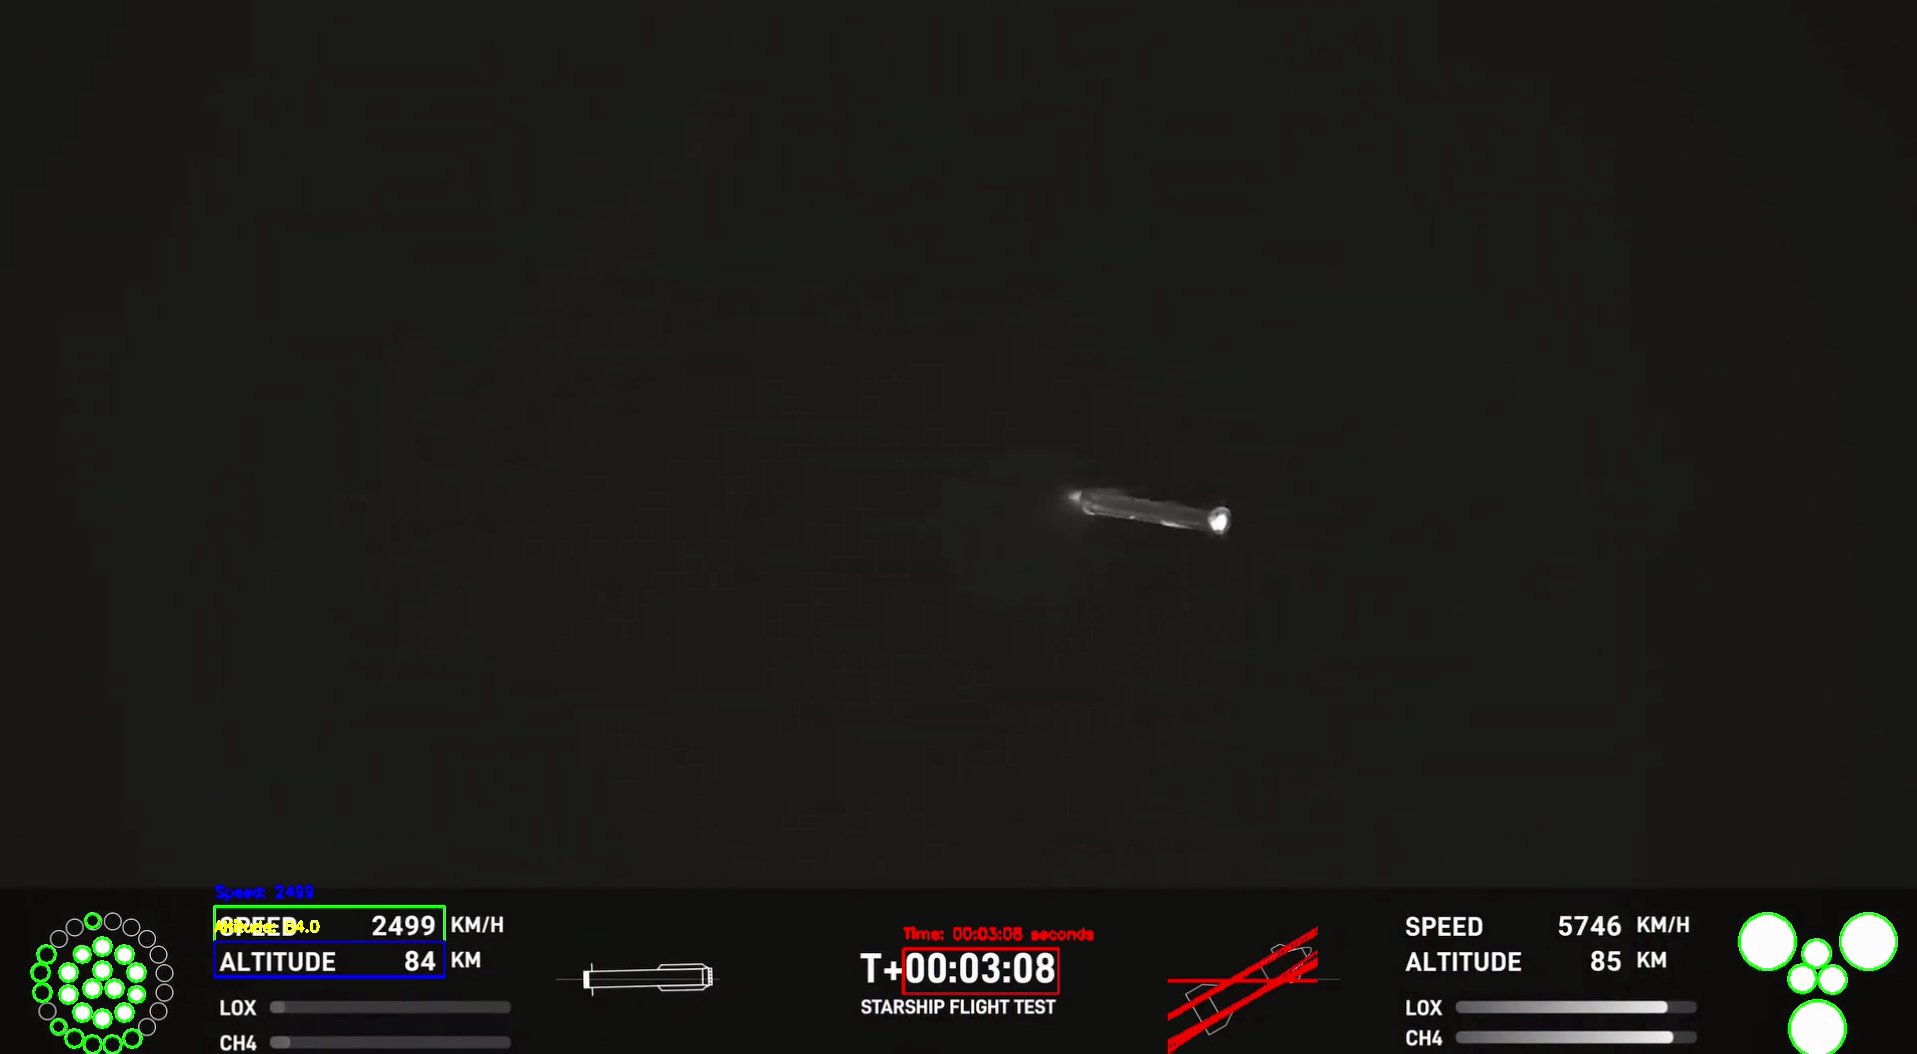
In this post, I’ll show you how these data points can be incredibly interesting and how, with this project, I’ve managed to process them in using an OCR engine called Tesseract, this allows me to analyze the data, draw conclusions, and even explore much more complex aspects that aren’t immediately visible during the launch.
I will also show you how the telemetry extraction program works, what its parts are and of course, how to use it yourself.
Project Context
The goal of this project has always been to extract relevant information from the telemetry publicly provided during live broadcasts of rocket launches, such as SpaceX’s Starship and Falcon 9.
The idea for this project came about because I am passionate about rocketry and I saw that after each Starship launch it changed a lot from one to the next, i was interested in identifying how these changes were reflected in the launch performance and flight profile.
My goals for this project were to have a good database with the telemetry of the launches so that I could analyze it and reach conclusions.
Finally, I have managed to have the largest accumulation of data in the Spanish community to date, analyzing up to 6 frames per second and having more than 10k lines in some launches.
Tools and Technologies Used
Python: Base language of the project.
Tesseract:
OCRtool used to extract text from images.OpenCV: Library for image and video processing.
Regular Expressions: To filter and process the extracted data.
Project Design
General Program Flow
Load launch video
Detect the region of interest (
ROI) where telemetry appears in the videoApply
OCRto extract the text from the videoFilter and clean the extracted data
Save the result in a
.csvand.xlsxfile
Initial Configuration
How to install Tesseract OCR:
- Windows
- Download the installer:
- Go to Official Tesseract Project Site and download
.exefile from the links in'Releases'
- Go to Official Tesseract Project Site and download
- Install Tesseract:
- Execute the
.exefile and follow the installer instructions - During the installation note or remember the directory where
Tesseractwill be installed (for example,C:\Program Files\Tesseract-OCR)
- Execute the
- Add Tesseract to the system PATH
Go to
"System Configuration" > "Advanced System Configuration" > "Environment Variables"Find the
Pathvariable in the system variables, edit it and add the path to theTesseract installation directory.
- Verify the installation:
- Open a terminal (cmd or PowerShell) and run:
tesseract --version
- Open a terminal (cmd or PowerShell) and run:
- Download the installer:
- Linux
Update the System
sudo apt update && sudo apt upgrade -yInstall Tesseract
sudo apt install tesseract-ocr -yVerify the installation:
tesseract --version
- MacOS
Install Homebrew (if you don’t have it):
/bin/bash -c "$(curl -fsSL https://raw.githubusercontent.com/Homebrew/install/HEAD/install.sh)"Install Tesseract:
brew install tesseractVerify the installation:
tesseract --version
- Python Independent of the OS, you can install the module for python with:
pip install pytesseract
Source Code
This is the following classes and files of the code and this is how it works:
Main Class:
1
2
3
4
5
from src.data_extraction import read_speed_and_altitude_from_video

video_path = 'C:/Users/your_user/Desktop/AeroTelemProc_VidData/data/media/ift6.mp4'

read_speed_and_altitude_from_video(video_path, "SuperHeavy", "00:02:58", "00:06:55")
In this class what we do is call the main class, to which we pass the path of the video from which we want to extract the telemetry (minimum quality of 1080p is recommended), we insert the vehicle we want to analyze and finally the start time of the analysis and the end time.
Data_Extraction Class:
1
2
3
4
5
6
7
8
9
10
11
12
13
14
15
16
17
18
19
20
21
22
23
24
25
26
27
28
29
30
31
32
33
34
35
36
37
38
39
40
41
42
43
44
45
46
47
48
49
50
51
52
53
54
55
56
57
58
59
60
61
62
63
64
65
66
67
68
69
70
71
72
73
74
75
76
77
78
79
80
81
82
83
84
85
86
87
88
89
90
91
92
93
94
95
96
97
98
99
100
101
102
103
104
105
106
107
108
109
110
111
112
113
114
115
116
117
118
119
120
121
122
123
124
125
126
127
128
129
130
131
132
133
134
135
136
137
138
139
140
141
142
143
144
145
146
147
148
149
150
151
152
153
154
155
156
157
158
159
160
161
162
163
164
165
166
167
168
169
170
171
172
173
174
175
176
177
178
179
180
181
182
183
184
185
186
from concurrent.futures import ThreadPoolExecutor
import cv2
import csv
from openpyxl import Workbook
from collections import deque
from src.angle_detection import detect_ship_angle
from src.engine_detection import analyze_engines
from src.propellant_detection import PropellantAnalyzer
from src.utils import cleanup, extract_text, time_to_ms
import re

def read_speed_and_altitude_from_video(video_path, profile, initTime, finishTime):
    """Reads the speed and altitude from a video file and saves the data to a CSV and Excel file."""
    cap = cv2.VideoCapture(video_path)

    cap.set(cv2.CAP_PROP_POS_MSEC, time_to_ms(initTime))

    profiles = {
        'SuperHeavy': {
            'rect_start_x': int(0.8 * 270),
            'rect_start_y': int(0.8 * 1135),
            'rect_width': 230,
            'rect_height': 35,
            'time_rect_start_x': 905,
            'time_rect_start_y': 950,
            'time_rect_width': 155,
            'time_rect_height': 45,
            "line_coordinates_lox": (270, 1042, 500, 1042),
            "line_coordinates_ch4": (270, 1006, 500, 1006)
        },
        'StarShip': {
            'rect_start_x': int(0.8 * 1750),
            'rect_start_y': int(0.8 * 1135),
            'rect_width': 230,
            'rect_height': 35,
            'time_rect_start_x': 905,
            'time_rect_start_y': 950,
            'time_rect_width': 155,
            'time_rect_height': 45,
            "line_coordinates_lox": (1460, 1040, 1690, 1040),
            "line_coordinates_ch4": (1460, 1050, 1690, 1050)
        },
        'Falcon9': {
            'rect_start_x': int(0.8 * 145),
            'rect_start_y': int(0.8 * 1205),
            'rect_width': 100,
            'rect_height': 40,
            'altitude_rect_x': int(0.8 * 345),
            'altitude_rect_y': int(0.8 * 1205),
            'time_rect_start_x': 890,
            'time_rect_start_y': 970,
            'time_rect_width': 200,
            'time_rect_height': 60
        }
    }

    if profile not in profiles:
        raise ValueError("Invalid profile. Choose from: SuperHeavy, StarShip, Falcon 9")

    current_profile = profiles[profile]
    print(current_profile['line_coordinates_lox'])

    rect_start_x = current_profile['rect_start_x']
    rect_start_y = current_profile['rect_start_y']
    rect_width = current_profile['rect_width']
    rect_height = current_profile['rect_height']
    time_rect_start_x = current_profile['time_rect_start_x']
    time_rect_start_y = current_profile['time_rect_start_y']
    time_rect_width = current_profile['time_rect_width']
    time_rect_height = current_profile['time_rect_height']
    line_coordinates_lox = current_profile['line_coordinates_lox']
    line_coordinates_ch4 = current_profile['line_coordinates_ch4']

    if profile == 'Falcon9':
        altitude_rect_start_x = current_profile['altitude_rect_x']
        altitude_rect_start_y = current_profile['altitude_rect_y']
    else:
        altitude_rect_start_x = rect_start_x
        altitude_rect_start_y = rect_start_y + rect_height

    speed_buffer = deque(maxlen=5)
    altitude_buffer = deque(maxlen=5)

    frame_counter = 0

    analyzer = PropellantAnalyzer()

    with open('C:/Users/your_username/Desktop/AeroTelemProc_VidData/data/telemetry_data.csv', mode='w', newline='') as csvfile:
        csv_writer = csv.writer(csvfile)
        csv_writer.writerow(['Time', 'Speed', 'Altitude', 'Angle', 'SuperHeavy_Engines', 'Starship_Engines', 'LOX', 'CH4'])

        workbook = Workbook()
        sheet = workbook.active
        sheet.append(['Time', 'Speed', 'Altitude', 'Angle', 'SuperHeavy_Engines', 'Starship_Engines', 'LOX', 'CH4'])

        while cap.isOpened():
            ret, frame = cap.read()
            if not ret:
                break

            height, width, _ = frame.shape
            if (rect_start_y + rect_height) > height or (rect_start_x + rect_width) > width:
                print("The velocity region exceeds the frame size.")
                continue

            speed_region = frame[rect_start_y:rect_start_y + rect_height, rect_start_x:rect_start_x + rect_width]
            altitude_region = frame[altitude_rect_start_y:altitude_rect_start_y + rect_height, altitude_rect_start_x:altitude_rect_start_x + rect_width]
            time_region = frame[time_rect_start_y:time_rect_start_y + time_rect_height, time_rect_start_x:time_rect_start_x + time_rect_width]

            cv2.rectangle(frame, (rect_start_x, rect_start_y), (rect_start_x + rect_width, rect_start_y + rect_height), (0, 255, 0), 2)
            cv2.rectangle(frame, (altitude_rect_start_x, altitude_rect_start_y), (altitude_rect_start_x + rect_width, altitude_rect_start_y + rect_height), (255, 0, 0), 2)
            cv2.rectangle(frame, (time_rect_start_x, time_rect_start_y), (time_rect_start_x + time_rect_width, time_rect_start_y + time_rect_height), (0, 0, 255), 2)

            if frame_counter % 5 == 0:

                cleaned_speed_region = cleanup(speed_region)
                cleaned_altitude_region = cleanup(altitude_region)
                cleaned_time_region = cleanup(time_region)

                with ThreadPoolExecutor() as executor:
                    speed_future = executor.submit(extract_text, cleaned_speed_region)
                    altitude_future = executor.submit(extract_text, cleaned_altitude_region)
                    time_future = executor.submit(extract_text, cleaned_time_region)

                    speed_text = speed_future.result()
                    altitude_text = altitude_future.result()
                    time_text = time_future.result()

                # Clean the detected text and extract only the numbers
                speed_numbers = re.findall(r'\d+', speed_text.replace('"', '').replace("'", '').strip())
                altitude_numbers = re.findall(r'\d+\.?\d*', altitude_text.replace('"', '').replace("'", '').strip())
                time_text = re.sub(r'[^0-9:]', '', time_text)

                if ret:
                    fuel_data_lox = analyzer.analyze_propellant_bar(frame, line_coordinates_lox)

                    print("LOX:",fuel_data_lox)

                    fuel_data_ch4 = analyzer.analyze_propellant_bar(frame, line_coordinates_ch4)

                    print("CH4:",fuel_data_ch4)

                # Get detected values
                if speed_numbers:
                    speed_value = int(speed_numbers[0])
                    speed_buffer.append(speed_value)
                else:
                    speed_value = "No speed detected"

                angle, roi_with_lines = detect_ship_angle(frame, deque(maxlen=5))
                if angle is None:
                    angle = "No angle detected"

                results = analyze_engines(frame)
                Starship_engine = results['starship']
                SuperHeavy_engine = results['booster']

                if altitude_numbers:
                    last_altitude_value = float(altitude_numbers[0])
                    altitude_buffer.append(last_altitude_value)
                else:
                    last_altitude_value = "No altitude detected"

                csv_writer.writerow([time_text, speed_value, last_altitude_value, angle, SuperHeavy_engine, Starship_engine, fuel_data_lox, fuel_data_ch4])
                sheet.append([time_text, speed_value, last_altitude_value, angle, SuperHeavy_engine, Starship_engine, fuel_data_lox, fuel_data_ch4])

                cv2.putText(frame, f"LOX", (line_coordinates_lox[0], line_coordinates_lox[1] - 10), cv2.FONT_HERSHEY_SIMPLEX, 0.5, (255, 0, 0), 2)
                cv2.putText(frame, f"CH4", (line_coordinates_ch4[0], line_coordinates_ch4[1] - 10), cv2.FONT_HERSHEY_SIMPLEX, 0.5, (255, 0, 0), 2)
                cv2.putText(frame, f"Speed: {speed_value}", (rect_start_x, rect_start_y - 10), cv2.FONT_HERSHEY_SIMPLEX, 0.5, (255, 0, 0), 2)
                cv2.putText(frame, f"Altitude: {last_altitude_value}", (altitude_rect_start_x, altitude_rect_start_y - 10), cv2.FONT_HERSHEY_SIMPLEX, 0.5, (0, 255, 255), 2)
                cv2.putText(frame, f"Time: {time_text} seconds", (time_rect_start_x, time_rect_start_y - 10), cv2.FONT_HERSHEY_SIMPLEX, 0.5, (0, 0, 255), 2)

            cv2.imshow('Original Frame', frame)

            if cv2.waitKey(1) & 0xFF == ord('q'):
                break

            if time_text == finishTime:
                print(f"Time reached: {time_text}. Stopping the program.")
                break
            frame_counter += 1

    cap.release()
    cv2.destroyAllWindows()

    workbook.save('C:/Users/your_username/Desktop/AeroTelemProc_VidData/data/telemetry_data.xlsx')
The file data_extraction.py contains a function read_speed_and_altitude_from_video which reads speed and altitude information from a video file and saves this data to CSV and Excel files. Here’s a simple explanation of how it works:
Imports: The file imports necessary libraries and functions, including
OpenCVfor video processing,CSVandopenpyxlfor file handling, and custom functions for angle detection, engine analysis, and propellant detection.Function read_speed_and_altitude_from_video:
- Input: Takes a video file path, a profile (e.g., SuperHeavy, StarShip, Falcon9), and initial and final times for data extraction.
- Process:
- Opens the video file and sets the starting position based on the initial time.
- Defines profiles for different object, specifying coordinates and dimensions for regions in the video frames where speed, altitude, and time information can be found.
- Extracts relevant data from the specified regions in the video frames.
- Saves the extracted data to CSV and Excel files.
- Output: The function does not return a value but saves the extracted data to files.
The function helps in extracting and saving speed and altitude information from video files based on predefined profiles for different types of spacecraft.
Angle_Detection Class:
1
2
3
4
5
6
7
8
9
10
11
12
13
14
15
16
17
18
19
20
21
22
23
24
25
26
27
28
29
30
31
32
33
34
35
36
37
38
39
40
41
42
43
44
45
46
47
48
49
import cv2
import numpy as np
from collections import deque

def detect_ship_angle(frame, angles_buffer):
    """Detects the angle of the Starship in the given frame."""

    x1, y1, x2, y2 = 1170, 900, 1320, 1080
    roi = frame[y1:y2, x1:x2]

    gray = cv2.cvtColor(roi, cv2.COLOR_BGR2GRAY)
    blurred = cv2.GaussianBlur(gray, (5, 5), 0)

    canny = cv2.Canny(blurred, 50, 150, apertureSize=3)

    lines = cv2.HoughLines(canny, 1, np.pi / 180, 60, np.array([]))

    if lines is not None:
        angles = []
        for rho, theta in lines[:, 0]:
            a = np.cos(theta)
            b = np.sin(theta)
            x0 = a * rho
            y0 = b * rho
            x1_line = int(x0 + 1000 * (-b))
            y1_line = int(y0 + 1000 * (a))
            x2_line = int(x0 - 1000 * (-b))
            y2_line = int(y0 - 1000 * (a))

            angle = np.degrees(np.arctan2((y2_line - y1_line), (x2_line - x1_line)))
            angles.append(angle)

            cv2.line(roi, (x1_line, y1_line), (x2_line, y2_line), (0, 0, 255), 2)

        angle_mean = np.mean(angles)

        angles_buffer.append(angle_mean)

        if len(angles_buffer) >= 5:
            smooth_angle = np.mean(angles_buffer)
        else:
            smooth_angle = angle_mean

        if abs(smooth_angle - angles_buffer[-1]) < 2:
            smooth_angle = angles_buffer[-1]

        return smooth_angle, roi
    else:
        return None, roi
The file angle_detection.py contains a function detect_ship_angle which detects the angle of a Starship in a given video frame. Here’s a simple explanation of how it works:
- Region of Interest (ROI): It defines a specific region in the frame where the angle detection will be performed.
- Image Processing: The function converts the ROI to grayscale and applies a Gaussian blur to reduce noise.
- Edge Detection: It uses the Canny edge detection algorithm to find edges in the blurred image.
- Line Detection: The Hough Line Transform is used to detect lines in the edge-detected image.
- Angle Calculation: For each detected line, the function calculates the angle in degrees and stores it in a list.
- Angle Averaging: It computes the average angle from the detected lines and adds it to a buffer.
- Smoothing: If there are enough angles in the buffer, it calculates a moving average to smooth the angle values.
The function helps in determining the orientation of the Starship by analyzing the angles of lines detected in the video frames.
Engine_Detection Class:
1
2
3
4
5
6
7
8
9
10
11
12
13
14
15
16
17
18
19
20
21
22
23
24
25
26
27
28
29
30
31
32
33
34
35
36
37
38
39
40
41
42
43
44
45
46
47
48
49
import cv2
import numpy as np

def check_circles(circles, roi, engines_on):
    """Check the detected circles and count the engines that are on."""

    if circles is not None:
        circles = np.round(circles[0, :]).astype("int")

        for (x, y, r) in circles:
            if y >= roi.shape[0] or x >= roi.shape[1]:
                continue

            motor_color = roi[y, x]

            if np.mean(motor_color) > 200:
                engines_on += 1

            cv2.circle(roi, (x, y), r, (0, 255, 0), 2)

    return engines_on

def analyze_engines(frame):
    """Analyze the engines in the given frame."""

    results = {
        "starship": 0,
        "booster": 0
    }

    x1, y1, x2, y2 = 1700, 900, 1920, 1080
    roi = frame[y1:y2, x1:x2]

    gray = cv2.cvtColor(roi, cv2.COLOR_BGR2GRAY)
    blurred = cv2.medianBlur(gray, 5)

    circles = cv2.HoughCircles(blurred, cv2.HOUGH_GRADIENT, dp=1.2, minDist=5, param1=50, param2=30, minRadius=10, maxRadius=30)
    results["starship"] = check_circles(circles, roi, results["starship"])

    x1, y1, x2, y2 = 20, 900, 180, 1080
    roi = frame[y1:y2, x1:x2]

    gray = cv2.cvtColor(roi, cv2.COLOR_BGR2GRAY)
    blurred = cv2.medianBlur(gray, 5)

    circles = cv2.HoughCircles(blurred, cv2.HOUGH_GRADIENT, dp=1, minDist=3, param2=20, minRadius=3, maxRadius=10)
    results["booster"] = check_circles(circles, roi, results["booster"])

    return results
The file engine_detection.py contains functions to analyze the engines in a given video frame. Here’s a simple explanation of how it works:
- Function check_circles:
- Input: Takes detected circles, a region of interest (
ROI), and a count of engines that are on. - Process: Checks each detected circle to see if it represents an engine that is on by analyzing the color at the circle’s center. If the color’s mean value is above a threshold, it increments the count of engines that are on.
- Output: Returns the updated count of engines that are on.
- Input: Takes detected circles, a region of interest (
- Function analyze_engines:
- Input: Takes a video frame.
- Process:
- Defines
ROIsfor the Starship and Booster engines. - Converts each
ROIto grayscale and applies a median blur to reduce noise. - Uses the Hough Circle Transform to detect circles in each
ROI. - Calls check_circles to count the engines that are on in each
ROI.
- Defines
- Output: Returns a dictionary with the counts of engines that are on for both the Starship and Booster.
The functions help in detecting and counting the number of engines that are on in specific regions of the video frames.
Propellant_Detection Class:
The file propellant_detection.py contains a class PropellantAnalyzer with a method analyze_propellant_bar which analyzes the propellant level in a given video frame. Here’s a simple explanation of how it works:
Imports: The file imports
OpenCVfor image processing and logging for error messages.- Class PropellantAnalyzer:
- Constructor __init__: Initializes the class without any specific attributes.
- Method analyze_propellant_bar:
- Input: Takes a video frame and line coordinates.
- Process:
- Validates the line coordinates to ensure they form a horizontal line.
- Extracts a region of interest (
ROI) from the frame based on the line coordinates. - Converts the
ROIto grayscale and normalizes the pixel values. - Detects a significant increase in grayscale values from the end of the line, indicating the propellant level.
- Uses linear interpolation for sub-pixel accuracy to determine the exact position of the increase.
- Output: Returns the position of the detected increase or “N/A” if there are errors.
The method helps in determining the propellant level by analyzing the grayscale values along a specified horizontal line in the video frames.
Utils Class
1
2
3
4
5
6
7
8
9
10
11
12
13
14
15
16
17
18
19
20
21
22
23
24
25
26
27
28
29
30
31
32
33
34
35
36
37
38
39
40
41
42
43
44
45
import numpy as np
import pytesseract
import re

def cleanup(im):
    """Cleans up an image by subtracting its median pixel value and then scaling it."""
    arr = np.array(im, dtype=float)
    if arr.mean(axis=-1).max() < 200:
        arr[:] = 0  # if there is no text, return black image
    else:
        arr -= np.median(arr) + 5
        arrmax = arr.max(axis=(0, 1))
        if all(arrmax != 0):
            arr *= 255 / arrmax
        arr = arr.clip(0, 255)
    return arr.astype(np.uint8)

def extract_text(image_region):
    """Extract text from the provided image region."""
    custom_config = r'--oem 3 --psm 7'
    return pytesseract.image_to_string(image_region, config=custom_config)

def time_to_ms(time_text):
    """Converts time in HH:MM:SS format to milliseconds."""
    parts = time_text.split(':')
    if len(parts) == 3 and all(part.isdigit() for part in parts):
        hours, minutes, seconds = map(int, parts)
        total_secs = hours * 3600 + minutes * 60 + seconds
        print(total_secs*1000)
        return total_secs * 1000
    return 0

def time_to_seconds(time_text):
    """Converts time in HH:MM:SS format to seconds."""
    parts = time_text.split(':')
    if len(parts) == 3 and all(part.isdigit() for part in parts):
        hours, minutes, seconds = map(int, parts)
        return hours * 3600 + minutes * 60 + seconds
    return 0  # If not in the correct format, return 0

def moving_average(data, window_size):
    """Calculates the moving average of a list of numbers."""
    if len(data) < window_size:
        return np.mean(data) if data else 0
    return np.mean(data[-window_size:])
The file utils.py contains utility functions for image processing, text extraction, and time conversion. Here’s a simple explanation of how each function works:
Imports: The file imports necessary libraries including
NumPyfor numerical operations,pytesseractfor text extraction, andrefor regular expressions.- Function cleanup:
- Input: Takes an image.
- Process: Cleans up the image by subtracting its median pixel value and scaling it. If the image has no text, it returns a black image.
- Output: Returns the cleaned-up image.
- Function extract_text:
- Input: Takes an image region.
- Process: Uses pytesseract to extract text from the provided image region with specific configuration settings.
- Output: Returns the extracted text.
- Function time_to_ms:
- Input: Takes a time string in HH:MM:SS format.
- Process: Converts the time to milliseconds.
- Output: Returns the time in milliseconds.
- Function time_to_seconds:
- Input: Takes a time string in HH:MM:SS format.
- Process: Converts the time to seconds.
- Output: Returns the time in seconds.
- Function moving_average:
- Input: Takes a list of numbers and a window size.
- Process: Calculates the moving average of the list over the specified window size.
- Output: Returns the moving average.
These utility functions assist with various tasks such as cleaning images, extracting text, converting time formats, and calculating moving averages.
Analysis and results
All the data is saved in two formats:
.xlsx.csv
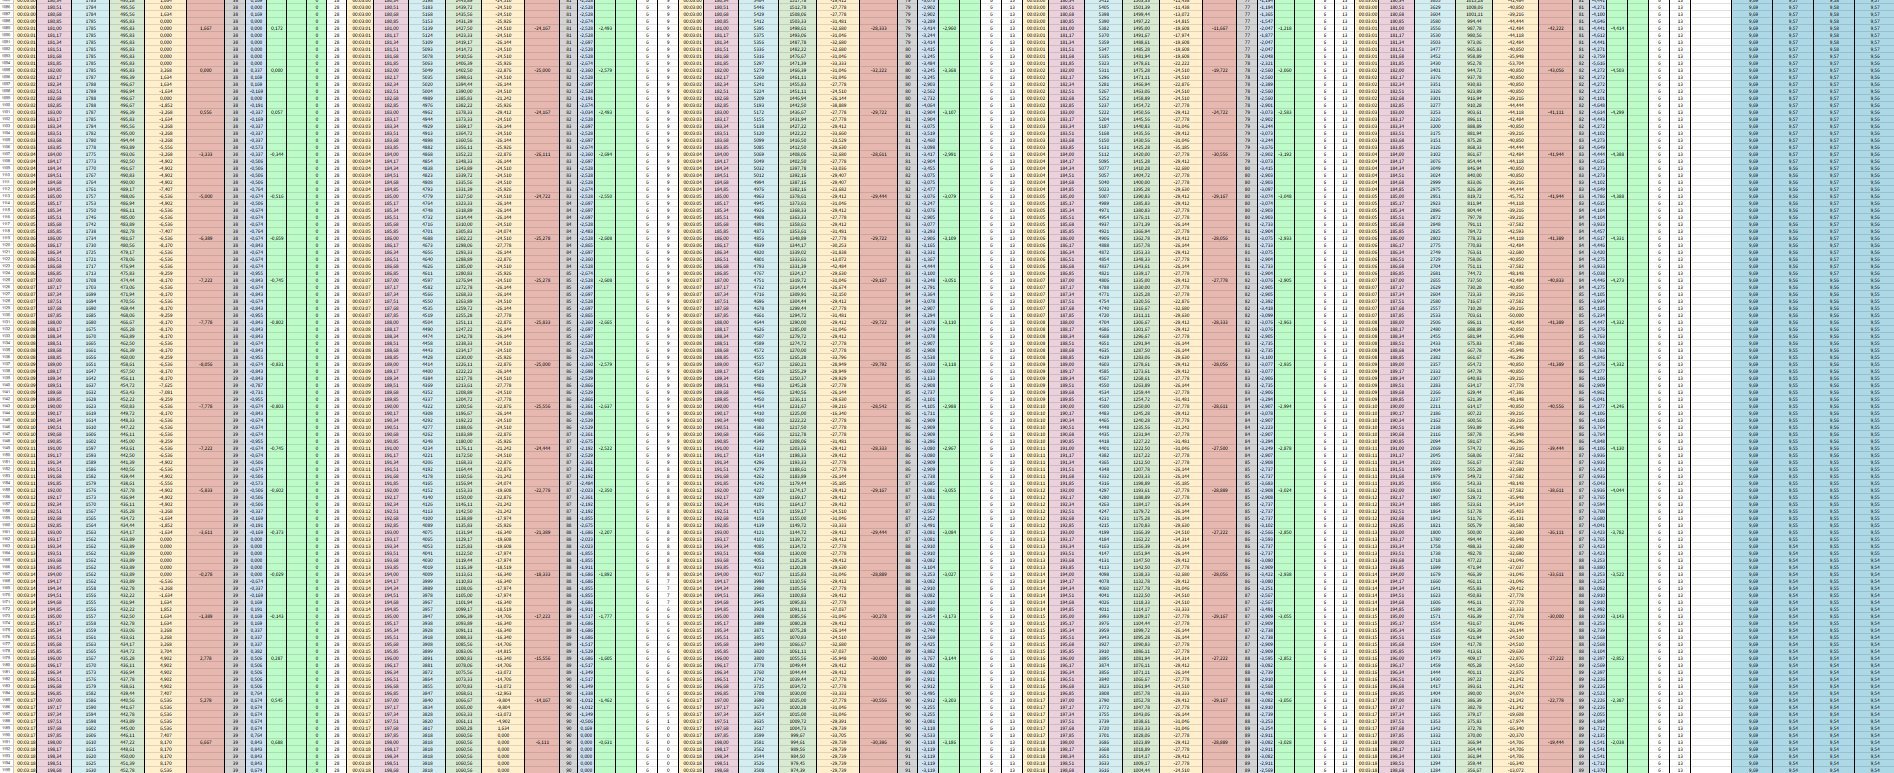
All telemetry data is saved in an .xlsx file, this is joined to the data added previously in a Google Sheet, where I make the different calculations and prepare them for analysis.
Here is all the telemetry saved up to Starship flight 6: (Google Sheet Starship Telemetry)[https://docs.google.com/spreadsheets/d/1QW8VqAGvxSJnrbFE_ByTIGqtHqvjOaXR4vESa94xsOA/edit?usp=sharing]
Information about the sheet
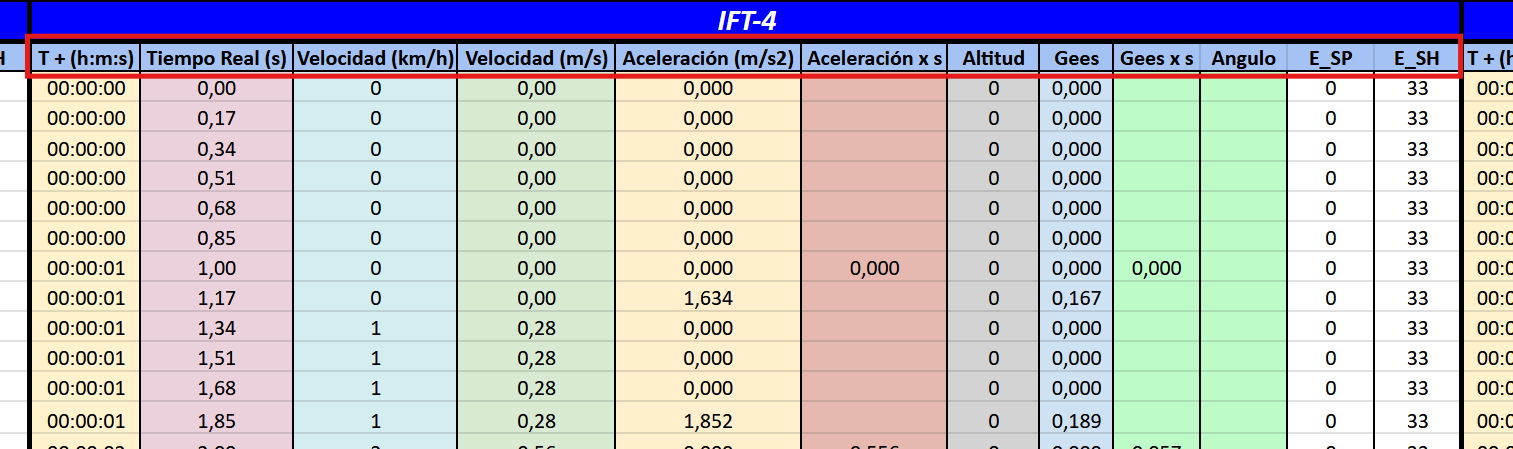
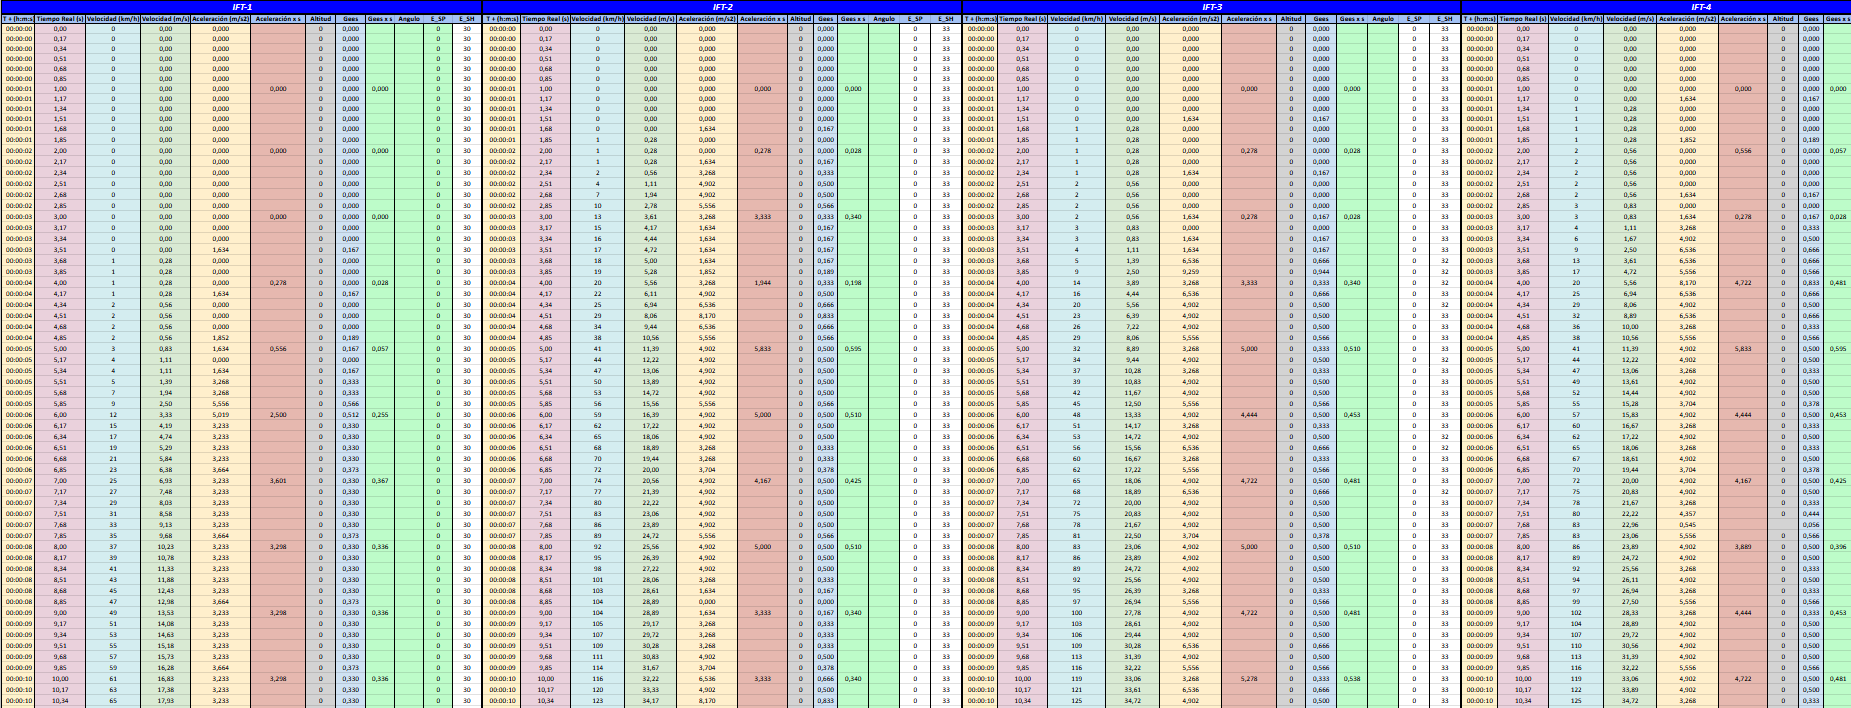
In the google sheet file we can see the deferent flights named like IFT-1/2/3…
In each of the flights there are many columns:
T + (h:m:s): Its represent the elapsed time since the start of the analysis, formatted as hours.
Real Time (s): This is the actual time in seconds.
Speed (km/h): This is the speed of the object in kilometers per hour.
Speed (m/s): This is the same but in
m/s, its calculated dividing the speed in Km/h by 3,6.Acceleration (m/s²): This is the rate of change of speed in meters per second, its calculated by taking the difference in speed over a period of time and dividing it by the time interval.
Acceleration x s: This is the same but the first acceleration is calculated each 0,17 seconds and this is calculated each 1 second.
Altitude: This is the height of the object above a reference point in this case, the sea level.
Gees: This represents the acceleration due to gravity, it is calculated by dividing the acceleration by the standard acceleration due to gravity (
9.81 m/s²).Gees x s: The same like the last Gees calculated, but in th is case each second.
Angle: This is the orientation of the object in degrees.
E_SP: This is the number of engines fired on the Starship.
E_SH: This is the number of engines fired on the Super Heavy.
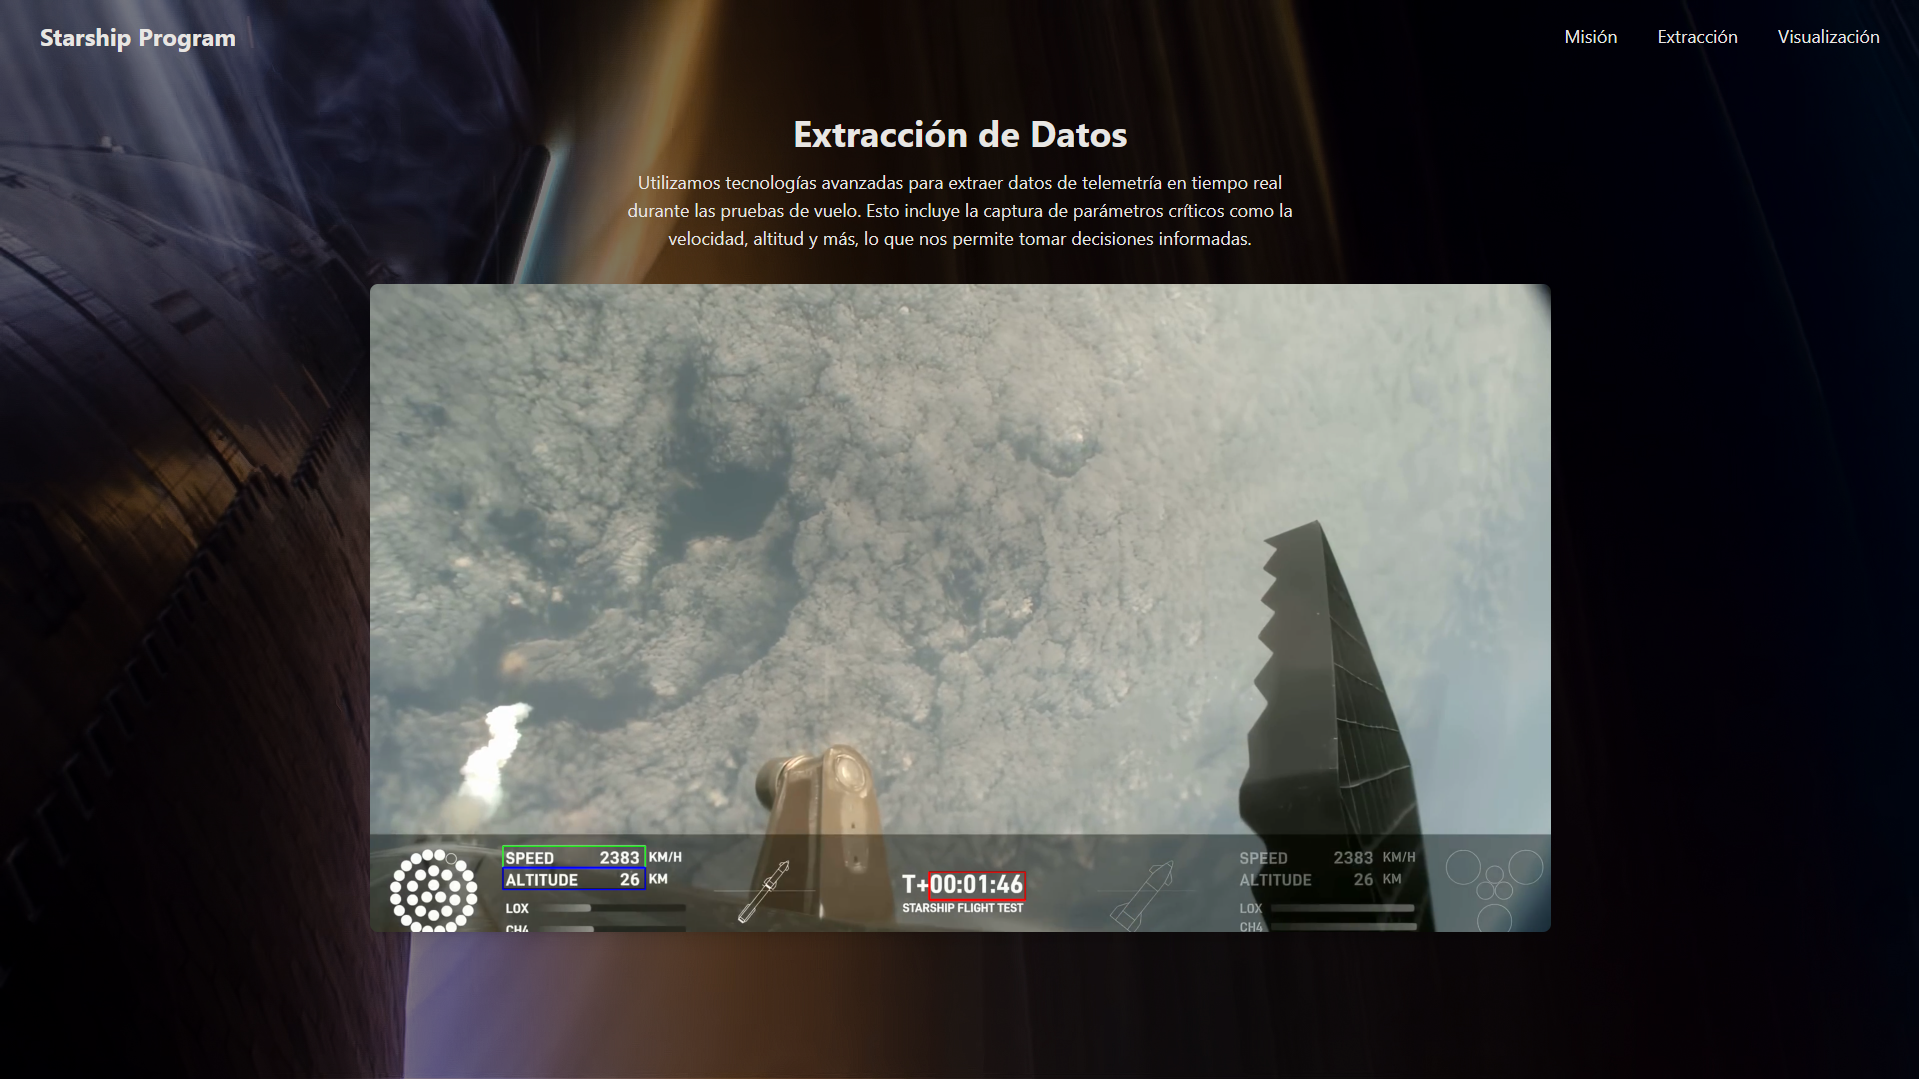
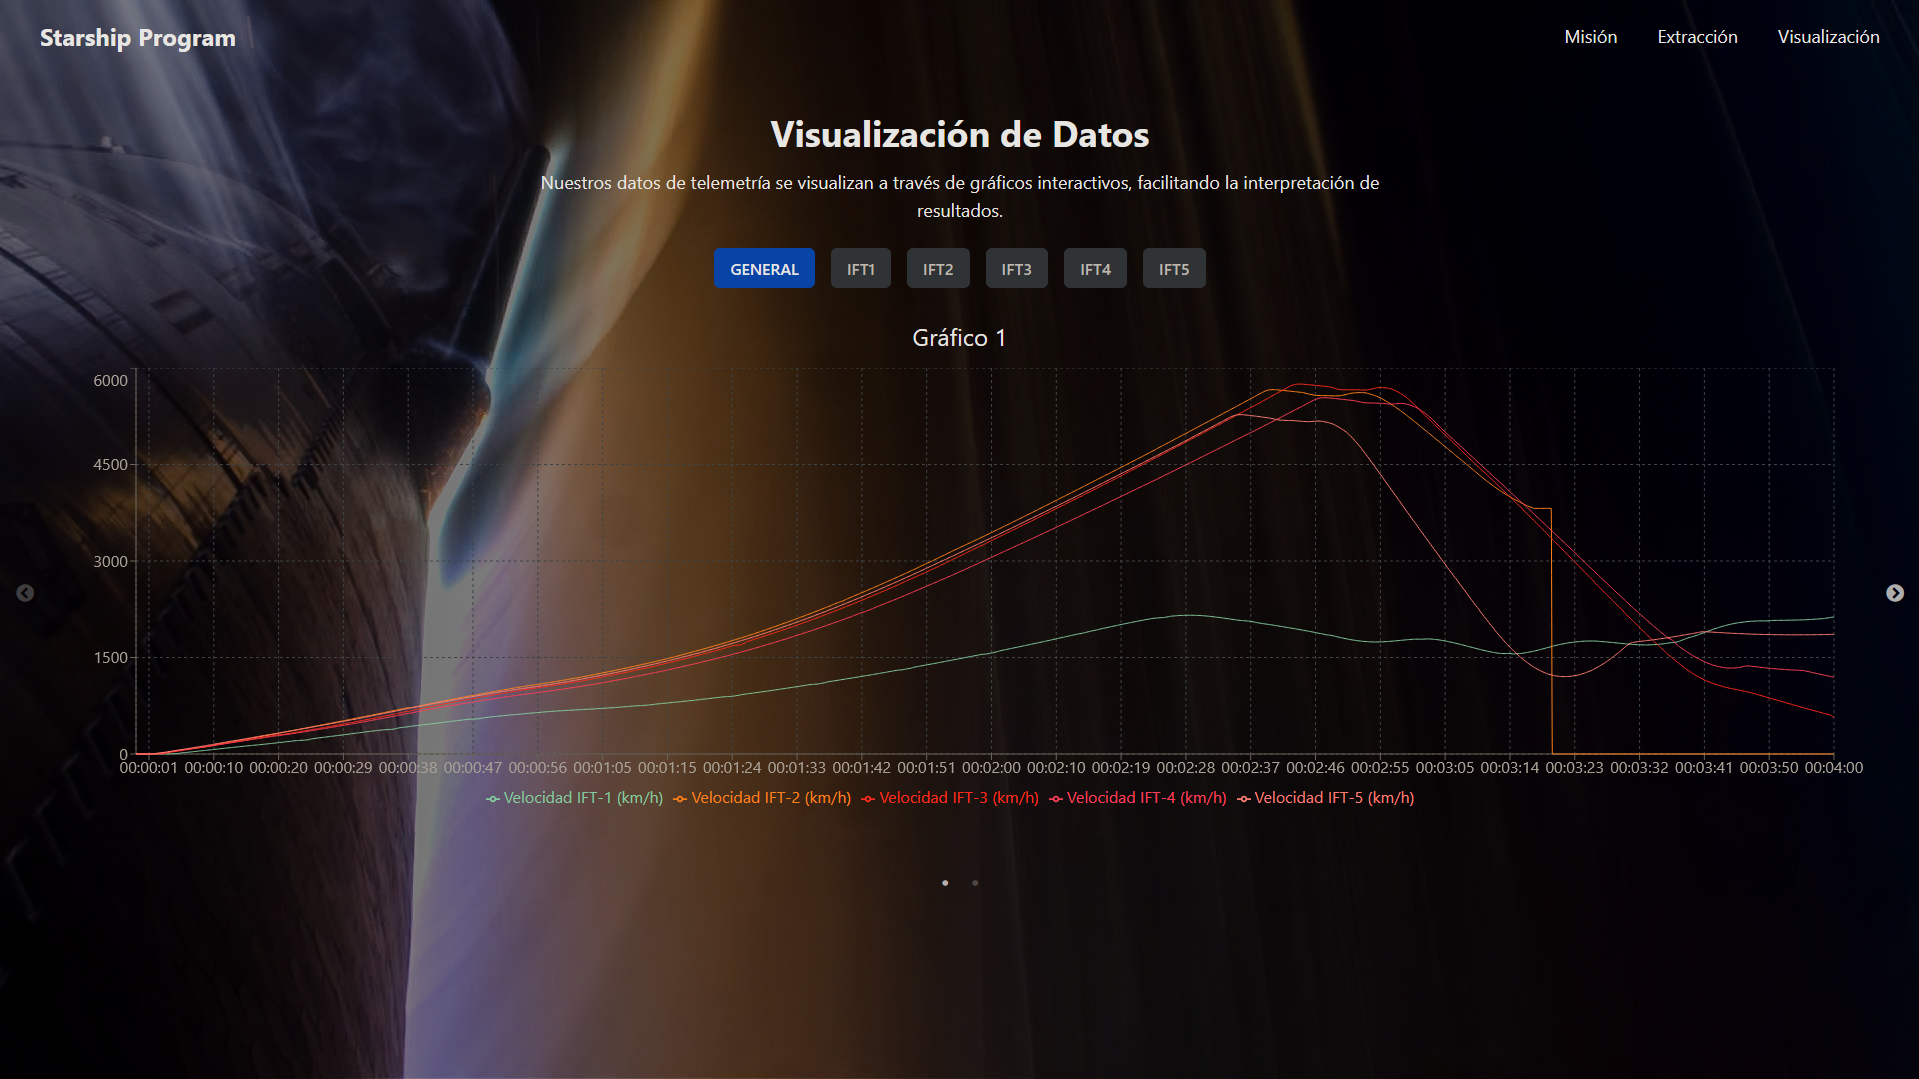
Display the data
The data will be displayed in many ways, one of this are using the charts tool in Google Sheets
Using this tool we can do a lot of type of charts but we are very limited, that’s why I decided to make a website using technologies like React to make a simple website to display the data
The website is still in development
Below I share a couple of screenshots of the progress of the website, in the next few months / weeks it will undergo changes for its improvement:
Technical Challenges
Throughout the development of this project I had many technical challenges due to the complexity of data extraction, image cleaning and processing, which I finally managed to solve and move forward over time. Some of there are the following:
Reduce image noise and clean it up by applying different methods to avoid false stops
Finding the exact
ROIfor accurate image processingWorking with the tiny fuel pixels, the noise made it impossible for me to detect them correctly.
In general and especially in terms of speed, there are problems with detecting numbers such as 4 or 3.
Applications and Future Improvements
Potential applications:
Real-time monitoring of launches.
Extracting data from other types of videos or streams.
Future Improvements:
Extract data in real time from directly the streams.
Use the program to extract data from all types of rockets and launches.
Better accuracy at the moment to extract velocity and propellant.
Found a way toi improve the data visualization.
Using
machine learningto improve the accuracy of collected data.Using a
non-sqldatabase to store large amounts of data.
Conclusions
In conclusion, this has been a unique project in which I have learned a lot about telemetry analysis, how to use OCR in Python to collect all that data, and especially how to manage it.
I have received help from various individuals in both the English and Spanish communities, and it has been an enriching experience.
Additionally, as of today, the Starship telemetry “database” is the largest in Spain, with over 10k rows for some launches.
I hope you enjoyed reading this article as much as I enjoyed creating it. Thank you for reading!